/buildings_card-fourth.webp)
.jpg)

/menu_Company_Open-positions_card-fourth.webp)

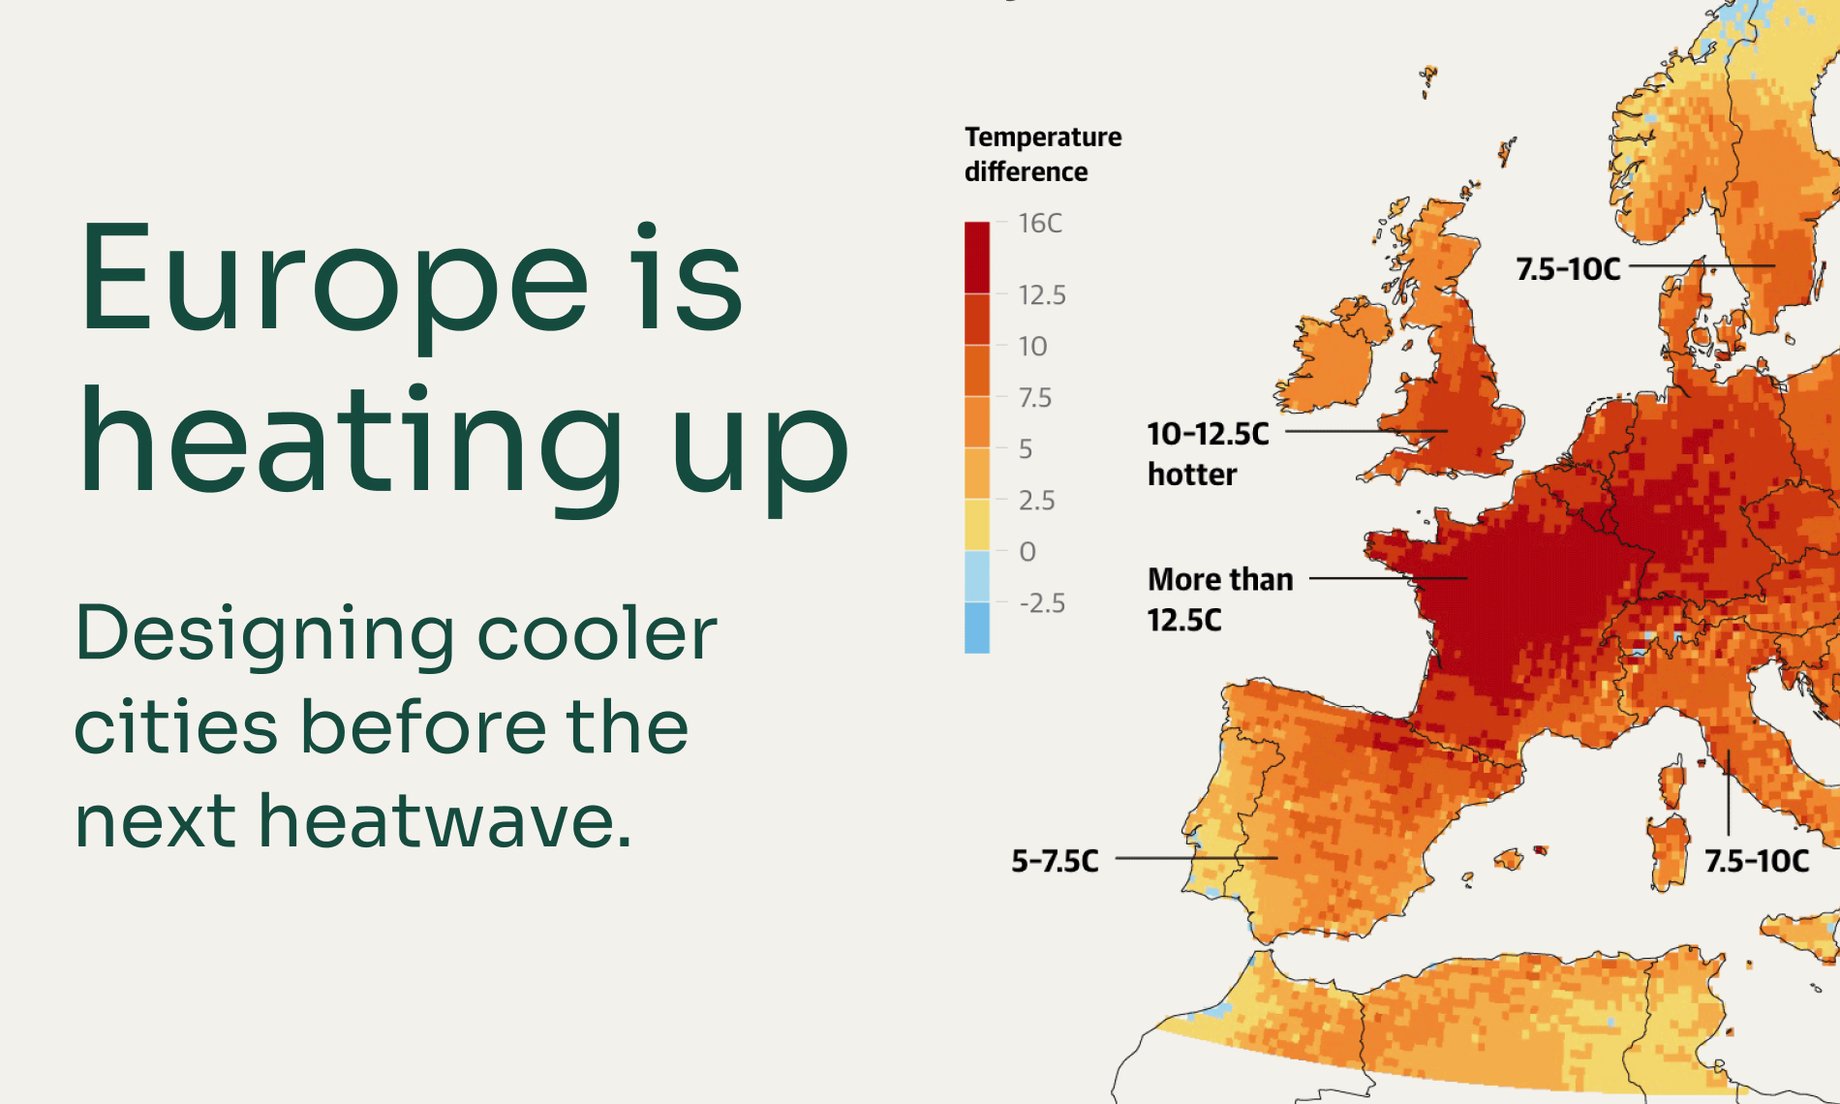
This article covers:
- What actually happened: the June 2026 heatwave by the numbers
- Heat is Europe's deadliest climate hazard
- Why cities feel it worse: the urban heat island effect
- From reaction to prevention: what cities can actually do
- Modelling heat before it's built: why microclimate simulation matters
- Designing cooler, more resilient cities
What actually happened: the June 2026 heatwave, by the numbers
According to the World Meteorological Organization (WMO) and the Copernicus Climate Change Service (C3S), June 2026 was the hottest June on record for Western Europe and the second-warmest globally, driven partly by record sea surface temperatures.
Confirmed national and local records include:
- All-time high record in Germany: 41.7°C on June 28, a provisional all-time national record and the third such record broken in as many days. The German Weather Service (DWD) confirmed that 252 stations broke all-time records and 46 exceeded 40°C, while a station in eastern Saxony recorded an overnight low of 29.4°C. DWD called the event "historic."
- All-time national high in Czech Republic: 41.9°C at Doksany on June 28.
- June record in Hungary: 40.7°C near Budapest.
- All-time high in Poland: A provisional all-time national record of around 40.5°C at Słubice.
- Vienna crossed 40°C for the first time: On June 28, the Austrian capital reached that mark, and hit a new national June record, later topped by 40.1°C at Bad Deutsch-Altenburg the next day.
- First-ever three consecutive Red Warnings in the United Kingdom: The Met Office issued Red Warnings for Extreme Heat on three consecutive days for the first time since the warning system began in 2021, as temperatures reached 37.3°C.
- New June record in the Netherlands: The country set a new national June temperature record as a Red Alert covered large parts of the country.
- All-time high in Denmark: 37.0°C, breaking the national record that had stood since record-keeping began in 1874.
- June record in Switzerland: 39.0°C in Basel, breaking the national June record that had stood since 1947
- Hottest day by national average in France: France recorded its hottest day by national average temperature (30.0°C on 24 June), with a local peak of 43.8°C in Pulluau, an overnight national record of 22°C, and a record 58 departments under the highest-level Red Alert.
- June record in Bilbao, Spain: Bilbao reached 42.7°C, its highest June temperature on record, while Andújar in southern Spain recorded a peak of 45.1°C.
Sources: WMO, Western Europe has hottest June on record" (2026); UK Met Office; DWD; Météo-France; Copernicus C3S, England’s warmest June on record – the second warmest for the UK and Wales, Western Europe has hottest June on record.
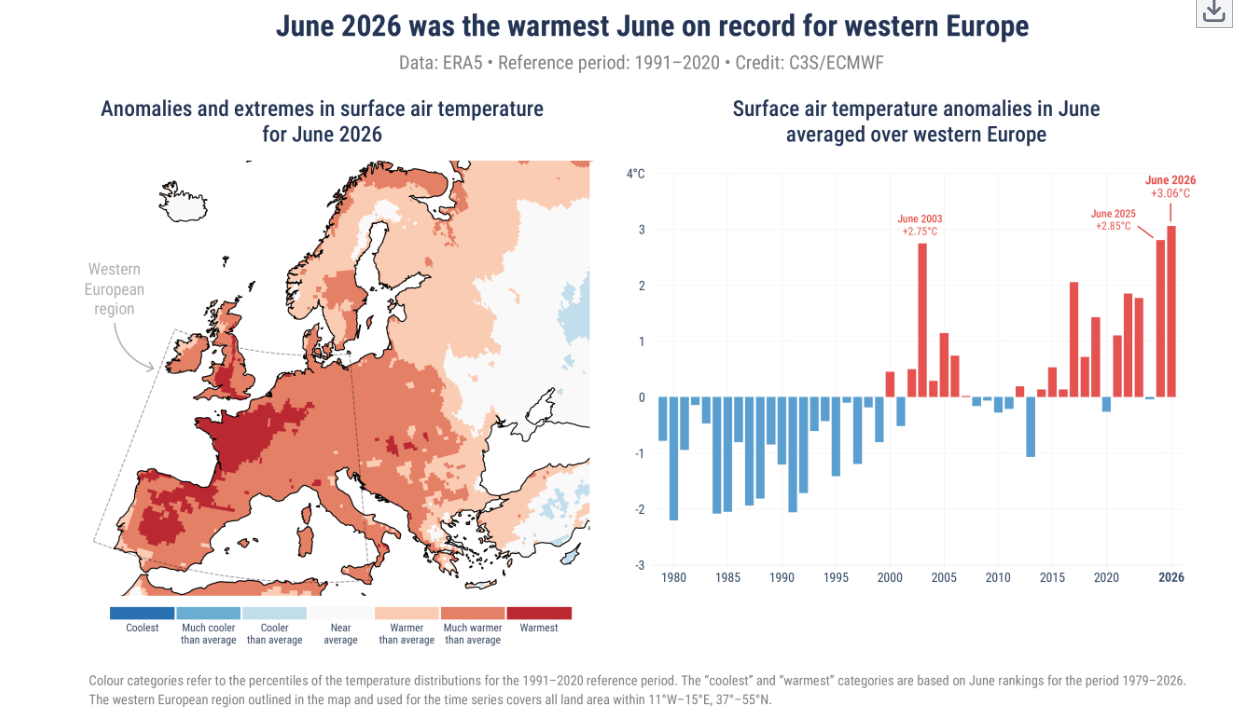
Source: Copernicus, European Union's Earth observation.
Heat is Europe's deadliest, and most invisible, climate hazard
Unlike floods or storms, heat leaves few visible traces of destruction, yet it consistently kills more people than any other weather-related hazard. The European Commission estimates that roughly 95% of European deaths linked to weather and climate hazards are caused by extreme heat, more than floods, storms, and wildfires combined.
The human cost of the 2026 heatwaves is still being finalized, since heat deaths are counted through excess mortality (comparing observed deaths to what would normally be expected) rather than a single official tally, and these figures are revised upward for weeks or months as data comes in. What has been confirmed so far:
- Looking at the full run of 2026 heatwaves together, independent epidemiological modelling has put total excess mortality at approximately 20,390 deaths (95% confidence interval), though estimates from different research groups vary and continue to be revised.
- EuroMOMO, the European mortality monitoring network backed by the ECDC and WHO, recorded more than 10,000 excess deaths across the continent in the single week of June 22–28 alone, over 9,000 of them among people aged 65 and older. A joint analysis by Imperial College London, the UK Met Office, and the London School of Hygiene & Tropical Medicine attributed roughly 42% of that excess to the additional heat caused by climate change.
- France recorded 2,025 official excess deaths in June.
- Spain reported more than 1,000 heat-related deaths.
- Germany's Robert Koch Institute estimated between 4,410 and 5,850 heat-related deaths by the end of June.
- England and Wales recorded roughly 2,700 excess deaths across the May and June heatwaves combined, per the UK Met Office and a UK Health Security Agency modelling study.
- Belgium recorded 1,747 excess deaths between June 18 and July 1, its deadliest heatwave in 30 years, per health agency Sciensano.
Heat kills through several overlapping mechanisms: cardiovascular strain, respiratory complications, dehydration and kidney injury, and the aggravation of existing chronic conditions. It also erodes labor productivity and cognitive performance in schools and workplaces.
One of the most dangerous features of modern heatwaves is the rise of tropical nights, nights when temperatures never fall below 20°C. Without cooler nighttime temperatures, the cardiovascular system cannot recover from daytime heat stress, and the risk of illness compounds day after day. High humidity worsens this further, which is why scientists increasingly rely on wet-bulb temperature, a combined measure of heat and humidity, to assess real physiological risk, rather than air temperature alone.
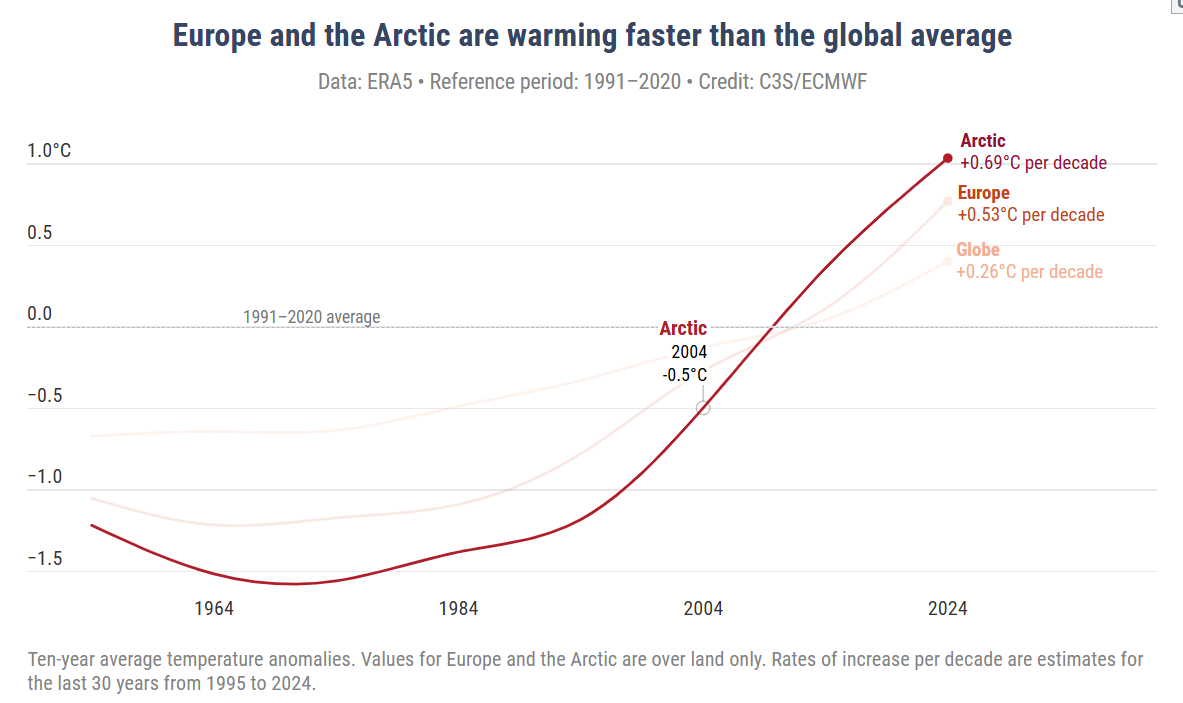
Source: Copernicus, European Union's Earth observation
Why cities feel it worse: the urban heat island effect
Climate change sets the baseline temperature, but cities make heatwaves worse locally through the Urban Heat Island (UHI) effect. Dense buildings, asphalt, concrete, dark roofing and a lack of vegetation absorb solar radiation during the day and release it slowly overnight.
The result:
- Urban air temperatures can run 2–8°C higher than surrounding rural areas.
- Tropical nights become more frequent and more intense in city centres.
- Cooling demand and electricity consumption spike, straining energy grids.
- Vulnerable populations, including the elderly, people with chronic illness, outdoor workers, and those without air conditioning, face prolonged, compounding heat exposure.
Foundational research from Oke (1982) and Santamouris (2015), reinforced by theIPCC's Sixth Assessment Report, consistently shows that the physical form of a city, including its street geometry, materials, greenery and building density, plays a major role in determining how hot residents actually experience a heatwave. In other words: urban design choices are a public health intervention.
From reaction to prevention: what cities can actually do
The practical question facing planners is no longer whether heat adaptation is needed, but which specific interventions work, where, and at what cost. Common strategies include:
1. Expand urban greening strategically
Trees, parks, and green corridors are among the most effective ways to cool cities. Vegetation provides shade while cooling the surrounding air through evapotranspiration, lowering both air and surface temperatures. However, research shows that simply adding more greenery is not enough. The location, size and configuration of green spaces significantly influence their cooling performance.
ENVI-met studies have demonstrated that larger, compact green spaces create stronger cooling within parks, while strategically grouping smaller green spaces near wider streets can extend cooling into surrounding neighborhoods by up to 1.3°C. Aligning green corridors with prevailing wind directions further enhances the distribution of cool air. In dense urban environments where creating large parks is often impractical, well-designed pocket parks, street trees and linear green corridors can deliver meaningful thermal benefits while improving biodiversity and public well-being.
2. Select materials that absorb less heat
Urban materials strongly influence local temperatures. Conventional asphalt and dark concrete absorb and store up to 95% of incoming solar radiation, releasing that heat slowly during the evening and contributing to the Urban Heat Island effect.
Replacing dark pavements with lighter, high-reflectance materials, permeable surfaces, or cool pavements can substantially reduce surface temperatures and improve pedestrian comfort. Roof materials are equally important. Cool roofs, reflective coatings, and green roofs reduce heat absorption, helping lower both building cooling demand and surrounding air temperatures. ENVI-met simulations allow planners to compare different material combinations and evaluate their impact before construction.
3. Integrate nature into buildings
Buildings themselves can become part of the cooling strategy. Green façades and green roofs provide insulation while reducing heat absorbed by building envelopes. ENVI-met simulations have shown that vegetated façades can lower external wall temperatures by up to 20°C compared with exposed concrete walls. Besides reducing surrounding air temperatures, these systems improve thermal comfort, enhance biodiversity, filter pollutants, and reduce building energy demand.
4. Improve airflow through climate-responsive urban design
The arrangement of buildings and streets has a major influence on how heat accumulates and dissipates. Poorly ventilated street canyons trap hot air, while carefully designed ventilation corridors allow cooler air to circulate through neighborhoods. Street orientation, building height, spacing, and the preservation of natural wind pathways should all be considered during planning. ENVI-met enables designers to simulate wind flow alongside radiation and thermal comfort, allowing alternative masterplans to be compared before implementation.
5. Incorporate blue infrastructure where appropriate
Water features such as ponds, fountains, and misting systems can provide local cooling through evaporation. Their effectiveness depends on the surrounding climate. In hot, dry regions, evaporative cooling can significantly improve outdoor comfort. In more humid climates, however, increasing humidity may reduce cooling benefits. Microclimate simulation helps determine where blue infrastructure is likely to be effective and how it should be integrated with vegetation and shading strategies.
Modelling heat before it's built: why microclimate simulation matters
Every city is different. Factors such as urban density, building geometry, vegetation, local climate, and prevailing winds all influence how effective a cooling strategy will be. A solution that performs well in one neighborhood may have little impact, or even unintended consequences, in another.
Rather than relying on rules of thumb, ENVI-met enables planners, architects and engineers to test multiple scenarios digitally, quantify their cooling potential and optimize designs before construction begins. This evidence-based approach supports more effective investments in climate adaptation, improves thermal comfort, and helps create healthier, more resilient cities. Typical applications include:
- Testing tree-planting strategies and comparing species for shade and cooling performance.
- Evaluating cool roofs, reflective pavements and other surface material choices.
- Quantifying the cooling potential of parks, green roofs, and other blue-green infrastructure.
- Optimizing street canyon geometry and building layout for natural ventilation.
- Comparing competing redevelopment or masterplan scenarios side by side.
- Estimating reductions in the Urban Heat Island effect from a specific intervention.
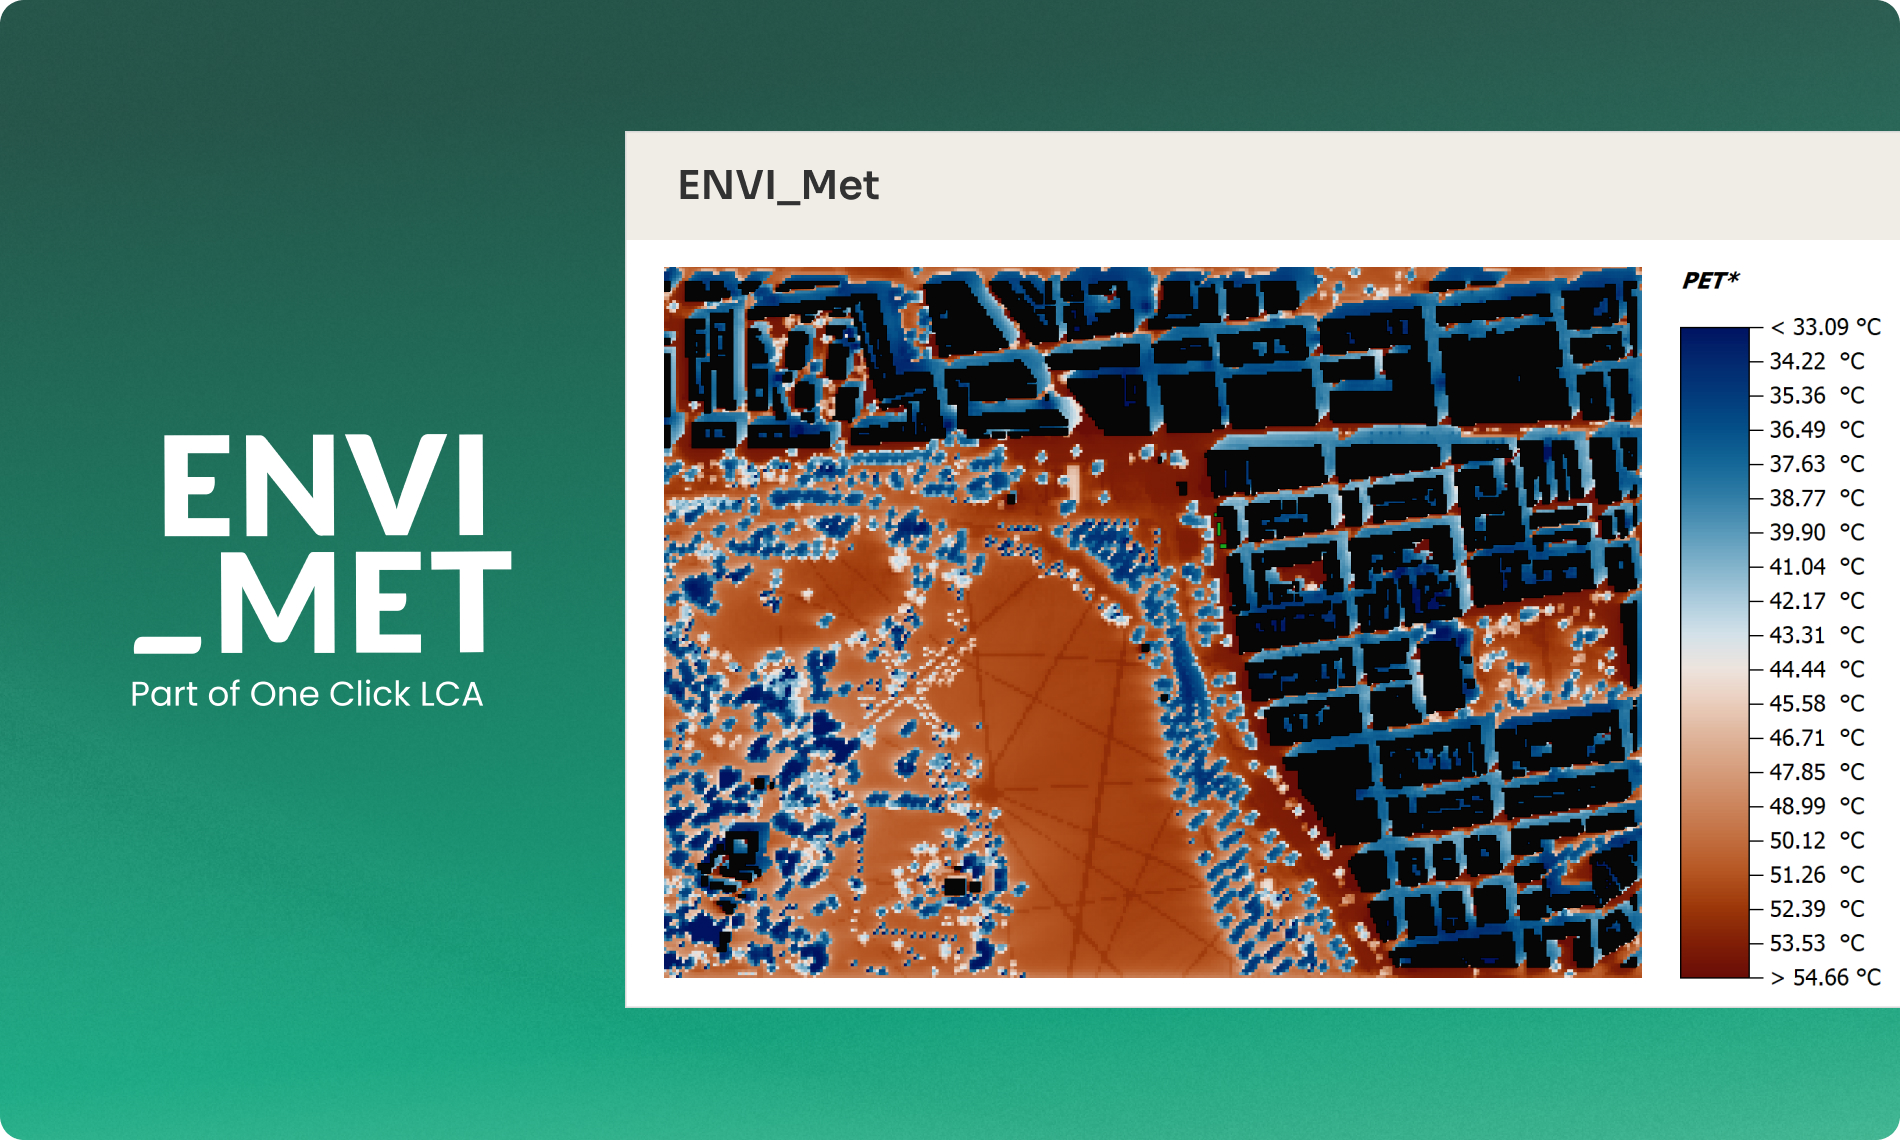
- Assessing pedestrian-level thermal comfort using internationally recognized indices such as PET (Physiological Equivalent Temperature) and UTCI (Universal Thermal Climate Index).
By simulating atmospheric physics, vegetation processes, soil moisture and building interactions together, ENVI-met effectively functions as a digital testing ground for climate adaptation strategies, letting cities compare the projected cooling impact and cost-effectiveness of different designs before committing public money to them, rather than discovering what works only after the next heatwave arrives.
The future of heat-resilient cities
The 2026 heatwaves are not an isolated disaster; they are a preview of a climate European cities were not built for. Reducing greenhouse gas emissions and embodied carbon remain the only ways to slow the underlying warming trend, but local adaptation can meaningfully reduce how much heat exposure residents experience in the meantime. Greener streets, reflective materials, better ventilation, and nature-based solutions all help, but their real-world effectiveness depends on evidence, not assumptions.
Simulation-based design tools like ENVI-met let cities move from reacting to heatwaves after the fact to proactively designing for them, turning climate science into measurable, testable urban resilience.
Frequently asked questions
1. Why are cities hotter than surrounding areas?
Cities experience the Urban Heat Island (UHI) effect because buildings and paved surfaces absorb and retain heat, vegetation is limited, airflow is restricted, and waste heat from traffic and buildings adds to warming. During heatwaves, urban temperatures can be 2–8°C higher than nearby rural areas.
2. What causes the Urban Heat Island effect?
Dark surfaces, dense buildings, reduced vegetation and anthropogenic heat combine to make cities warmer than their surroundings. Climate change raises baseline temperatures, while the Urban Heat Island effect amplifies heat locally.
3. What is ENVI-met?
ENVI-met is a 3D microclimate simulation software that models interactions between buildings, vegetation, materials and weather. It helps planners evaluate urban cooling strategies, such as trees, green roofs and reflective materials, before construction.
4. How accurate is ENVI-met?
ENVI-met has been validated against field measurements in numerous peer-reviewed studies and is widely regarded as a leading tool for neighbourhood-scale microclimate modelling. Accuracy depends on the quality of the input data.
5. Can trees really reduce urban temperatures?
Yes. Trees cool cities through shade and evapotranspiration, lowering surface temperatures by up to 25°C and local air temperatures by 1–5°C while improving thermal comfort, biodiversity and air quality.
6. What is PET?
Physiological Equivalent Temperature (PET) is a thermal comfort index that combines air temperature, humidity, wind, radiation and human factors to estimate how hot outdoor conditions feel.
7. What is UTCI?
The Universal Thermal Climate Index (UTCI) measures outdoor heat stress by combining temperature, humidity, wind and radiant heat. It is widely used to assess health risks during heatwaves.
8. How can cities prepare for future heatwaves?
Cities can reduce heat by expanding tree cover and green infrastructure, using cool materials, protecting ventilation corridors and implementing heat action plans. Simulation tools such as ENVI-met help identify the most effective interventions before they are built.